New insights are now available detailing last year’s unprecedented surge in fishing and hunting participation. The free-to-use license-sales dashboard, developed over the past several years via a partnership of states, industry, and sportsman’s organizations, provides an interactive way for users to explore sales trends. The latest license dashboard is available at www.asafishing.org/data-dashboard/.
Here are some initial insights:
- Total licenses sold –
- Fishing: up 13.5% in 2020 over 2019
- License sales to women increased 24% in 2020, only 10% for men.
- Hunting: up 5%
- Purchases by women grew 15%, but only 4% for males.
- Sales in November 2020 fell below November 2019 levels. It appears many hunters shifted their license buying to earlier months during the pandemic.
- Fishing: up 13.5% in 2020 over 2019
- New recruits –
- Fishing: Up 38% over 2019’s levels.
- Purchases by first-time female anglers up 48%!
- Hunting: Up 26%
- The number of new female hunters was up 41%! Males by 23%.
- Fishing: Up 38% over 2019’s levels.
- Churn rates (renewal rates) –
- Fishing: 42% of 2019’s license buyers did not renew in 2020, better than the 45% who did not renew the year before.
- Women were more likely to renew in 2020 than men.
- Hunting: The churn rate surprisingly increased 4% for reasons not yet known.
- Women reduced their churn rates in 2020, but the increased rate by men drove the overall results.
- Fishing: 42% of 2019’s license buyers did not renew in 2020, better than the 45% who did not renew the year before.
- For all categories above, the younger the hunter or angler, the greater their rates of buying licenses in 2020. Along with the increase in women buying licenses, this is welcome news as the number of women and people under 35 buying licenses had declined from 2016 to 2019. 2020’s gains were greater than the 2016-19 losses.
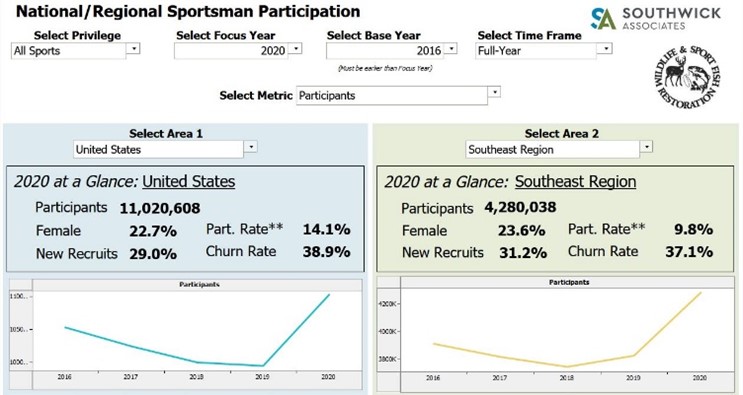
We invite you to explore the dashboard to learn more about license sales for the past 10 years. The license dashboard was originally conceived to help state fish and wildlife agencies plan and evaluate hunter and angler recruitment, retention and reactivation (R3) efforts.
The current dashboard is based on license sales data for 20-25 states. Additional states are added regularly. Updates will then be issued roughly every six months. Efforts are underway to develop a “real time” dashboard, too. The dashboards have been funded by a combination of industry dollars and annual grants from the Sport Fish and Wildlife Restoration Trust Fund, awarded by the Association of Fish and Wildlife Agencies (AFWA) and administered by the US Fish and Wildlife Service (USFWS). The grants have been managed by the American Sportfishing Association (ASA) and the Archery Trade Association (ATA). Please contact Lisa@SouthwickAssociates.com with any questions.