Data Dashboards: R3 Evaluation Tool
Monitoring trends and shifts in the customer base is vital if recruitment, retention and reactivation (R3) efforts are to reach their maximum potential. Understanding these trends and shifts will enable state wildlife agencies to better understand who is buying licenses and permits or not, if sportsmen’s license renewal rates are improving or not, where sales are strengthening or weakening, and more. Tracking these factors is imperative to maintain conservation funding and ensure strong constituent voices calling for continued and increased conservation efforts.
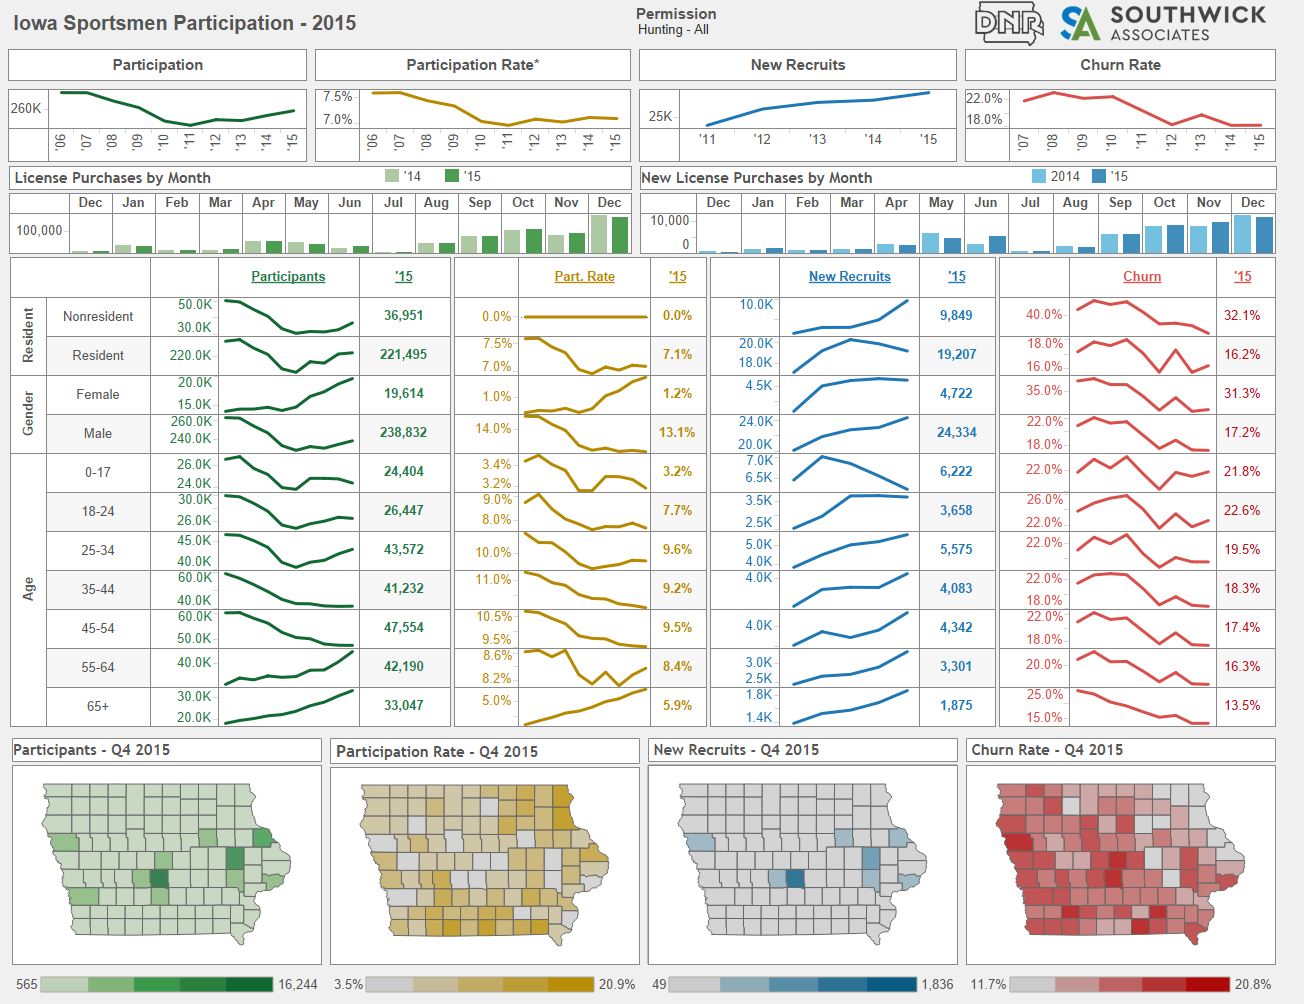
Data dashboards, recently piloted in Oregon, provide agency staff with quick, easy-to-interpret insights into state license data without placing significant burden on agency license analysts. Using standard software such as Tableau, data dashboards provide a visual representation of key license and permit sales trends plus participation shifts within key demographic categories such as residency, gender, age and county of residence. By providing simple, regular and consistent summaries of customer buying and participation trends, data dashboards help state agencies better identify if R3 efforts are working and where adjustments and changes are needed.
License Data Dashboards – Increasing Agency Knowledge of Customer Trends and R3 Effectiveness
Scientists by nature, state wildlife agencies need information to guide planning, programs and budgets. Knowing license-buying trends among different customer groups, as well as understanding if marketing efforts are succeeding, is important if agencies are to make smart strategic and program planning decisions. But many states do not have access to these insights. Given the data handling skills needed to assess license data bases are limited, the time required for over-stretched licensing staff to generate detailed licensing trends statistics often prevents agencies from understanding license sales trends and evaluating marketing efforts. This limitation can discourage states from making significant marketing and evaluation investments.
One solution to this dilemma is a “data dashboard.” This concept, originally promoted through the Western Association of Fish and Wildlife Agencies, provides states with easy-to-access insights into license sales. By requesting only one full copy of license sales every quarter, demands on license staff are reduced. Then, the data are entered into a pre-determined set of tabulations using a software package such as Tableau. Using a free reader version of the software, any and all state agency staff can then quickly and very easily assess license trends and watch if targeted customer groups are responding to new initiatives. Users do not need to be trained data analysts or purchase expensive software. An outside group like Southwick Associates, who is building data dashboards for several states, prepares the quarterly data and distributes it to agency staff. All agency staff, from their own desks, can then run simple queries and see the problems facing their agency’s revenue sources and the effects of agency marketing efforts. The results include better insights on customer participation rates and revenue trends, plus greater support and buy-in from agency staff trained otherwise to be skeptics.
The NSSF encourages states to consider data dashboards, not only to help boost internal understanding and buy-in for the agency’s strategic initiatives, but to also collectively track trends across all states. Collective data tracking efforts will allow for smarter, more effective and ultimately increased investments by outside organizations and partners in future recruitment, retention and reactivation efforts. Contact Southwick Associates (Lisa@SouthwickAssociates.com) for more information.
 This interactive tool provides a quick grasp of patterns and trends in license sales, hunter education, boat registrations and more periodic updates to track long-term R3 program effectiveness & license sales trends.
Timely, accurate participation data and trends will help you:
- Better market your licenses by knowing who’s buying what, hunter and angler demographics, sales by license type and more
- Improve your R3 strategies and tactics based on consistent, reliable metrics
- Track individuals’ license-buying and churn patterns
- Connect your R3 program participants to license databases
- Increase agency buy-in for R3 and marketing efforts by using reliable evaluation data
Data dashboards typically priced from:
- $7,500 for fishing or hunting
- $15,000 for both including breakouts for up to 10 privileges
- Prices may vary based on content and data quality
Southwick Associates can also assess license databases to:
- Develop R3 marketing strategies
- Identify R3 target audiences
- Establish baseline metrics for participation and churn rates and more